High Resolution Optical Spectrum Analyzer
The Highest Resolution Optical Spectrum Analyzer in the market
Discover the highest resolution Optical Sprectrum Analyzer in the market now available for many different wavelength ranges between 843 nm to 1630 nm.

Wavelength ranges available
(Any custom range available upon request)
Thanks to the integration of our own homemade external cavity tunable laser source (TLS) as a local oscillator, we offer a large range of Optical Spectrum Analyzers mostly between 844 nm to 1630 nm. We can reach ultra-high resolution in the NIR, T, O, E, S and C+L bands, thanks to our mode hop-free local oscillator technology. The TLS can be integrated inside the equipment or into an external benchtop as an option. The advantage of the latter configuration is that the TLS can be used as a local oscillator and be connected to our other equipment that are also based on interferometric principle (OCSA, OFDR).
Available wavelength ranges:
NIR
843 - 863 nm
T Band
1037 - 1069 nm
O Band
1260 - 1360 nm
E Band
1345 - 1450 nm
S Band
1445 - 1525 nm
C+L Band
1520 - 1630 nm
Custom wavelength ranges (upon request):
T Band
1075 - 1260 nm
Above C+L Band
Above 1630 nm
Key Specifications
The world's highest optical bandwidth resolution Optical Spectrum Analyzer
0.04 pm Resolution
Dynamic range
- Wavelength accuracy: ± 2 pm
- Repeatability: ±0.5 pm
- Sweep time: Up to 200 nm/s
Ultra-high Optical Bandwidth Filter Resolution
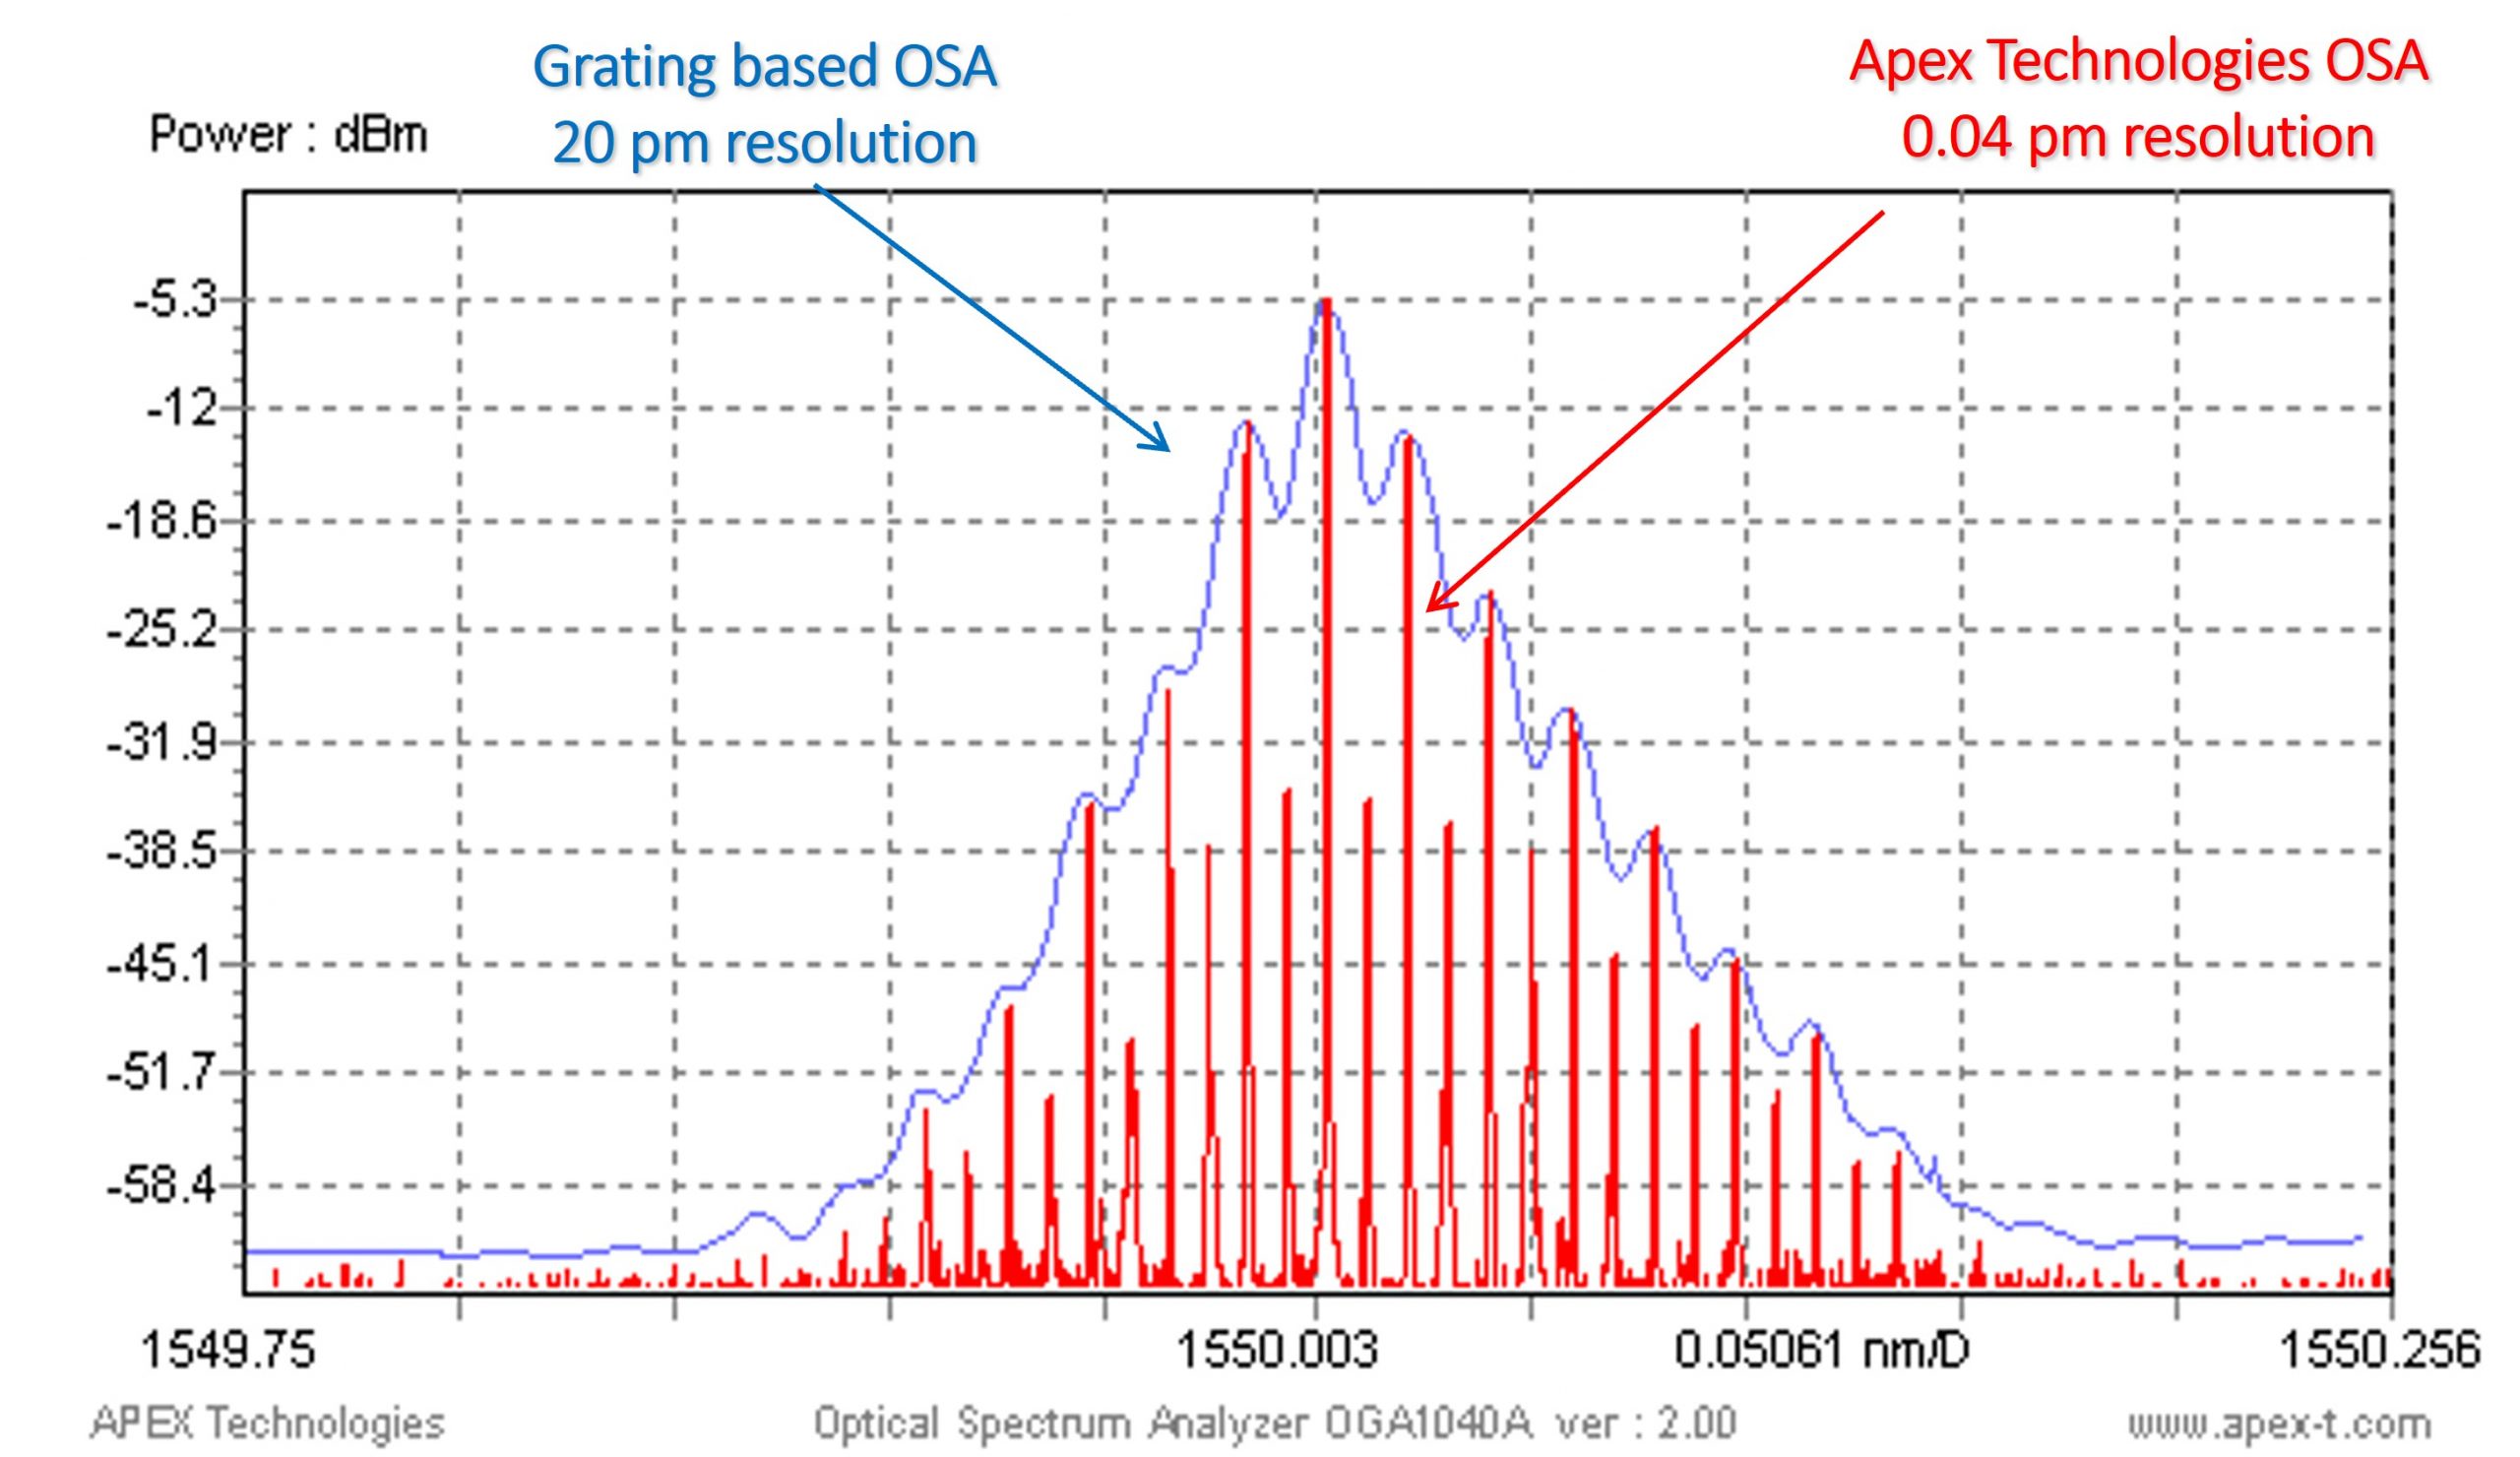
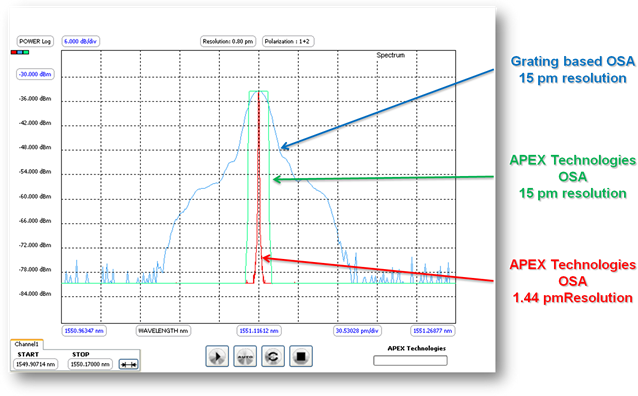
With up to 500 times better resolution than the best standard grating-based Optical Spectrum Analyzer on the market, our new generation of Optical Spectrum Analyzers can display your signal’s real spectrum shape instead of just its envelope.
Use it as a wavelength meter
The 3 internal Wavelength calibrators (absolute and relative) allow the equipment to provide an excellent wavelength accuracy specification (+/- 2 pm). This high wavelength accuracy gives the possibility to use the equipment as a wavelength meter.

Excellent dynamic range and close-in dynamic range
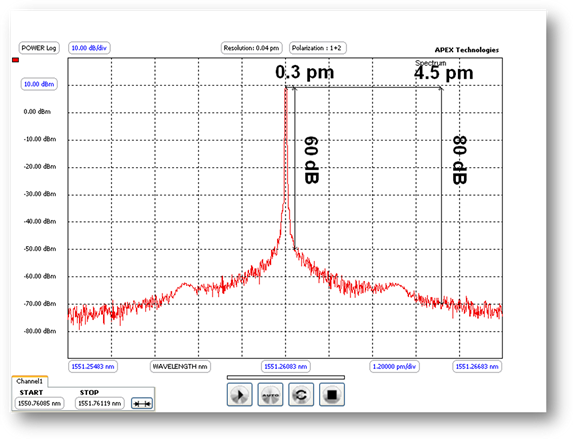
Our Optical Spectrum Analyzers achieve more than 83 dB of dynamic. They also have the unique advantage of having a high dynamic range close to the peak. When the best standard grating-based OSA can achieve 78 dB at +/- 1 nm, our Optical Spectrum Analyzers can achieve 80 dB at +/- 6 pm from the peak.
Perfect resolution filters for OSNR measurements
Several resolution filters between 5 MHz and 140 MHz are available. We use rectangular shape resolution filters which allow a nearly perfect integration of the signal over the selected resolution, whereas a grating-based Optical Spectrum Analyzer filter integrates inside a wide base triangular shape.
Two Optical Spectrum Analyzer channels, one per polarization axis
The input signal is split into two orthogonal polarization axes, analyzed simultaneously by two internal independent channels. Our Optical Spectrum Analyzer has the unique advantage to display the two polarization channels separately and simultaneously.

OPTIONS
Built-in Tunable Laser Source(s) can be used as independent Tunable Laser(s) through an output port and a laser control software module. This allows to benefit from the combined narrow linewidth, good SMSR and fine wavelength setting resolution for other experiments in the lab.
Another option is to have the Tunable Laser Source(s) as standalone external benchtop(s). A single laser can then be used as the local oscillator for other APEX Technologies products such as the Optical Complex Spectrum Analyzer (OCSA) and the Optical Frequency Domain Reflectometer (OFDR), while providing maximum power output for other experiments in the lab.

")
Two (2) independent signals can be analyzed simultaneously with the two (2) optional PM input ports, directly connected to TE and TM polarization channels, respectively.
That's like owning two distinct Optical Spectrum Analyzers !

The Tracking generator option turns the Optical Spectrum Analyzer into a Optical Component Analyzer by synchronizing the local oscillator output (or the external TLS benchtop) with the Optical Spectrum Analyzer measurement. Passive components can therefore be measured in both transmission and reflection with a > 60 dB dynamic range and a 1 MHz resolution. This allows for high performance characterization of Fiber Bragg Gratings (FBG), PIC micro-rings, or any other component with narrow and/or "deep" spectral features.


The Polarimeter option allows the state of polarization of the signal to be measured. Three different displaying modes exist: Jones graph, Poincaré sphere and Stockes parameters oscilloscope. Polarization Extinction Ratio (PER) can be measured too.


Tools and documentation
Similar product

OPTICAL COMPLEX SPECTRUM ANALYZER
High resolution optical Spectral and Temporal intensity and phase measurement
More than an Optical Spectrum Analyzer, this equipment can additionally measure the relative phase of a repetitive signal. Characterize the full complex optical field, unlocking phase, intensity and frequency chirp as a function of time, eye diagrams and constellation.


Copyright © 2026 Apex Technologies